See it work
Demos
Three capabilities no grid forecaster offers, each with the code that produced the plot. Every figure comes from a committed script in the repo.
predict_at
Forecast at any moment in time
One trained model, queried at arbitrary real-valued timestamps — fractional steps, between observations, even beyond the trained horizon — because the decoder integrates a continuous-time ODE. Conformal intervals come interpolated across time.
from apdtflow import APDTFlowForecaster, set_seed
set_seed(0)

model = APDTFlowForecaster(
    forecast_horizon=14, history_length=60, num_epochs=8,
    decoder_type='continuous',   # enables predict_at / predict_when
    use_conformal=True,          # calibrated uncertainty
)
model.fit(df, target_col=value_col, date_col=date_col)

# query at arbitrary times: fractional steps and beyond the horizon
values, lower, upper = model.predict_at([3.5, 7.2, 14.0, 18.0])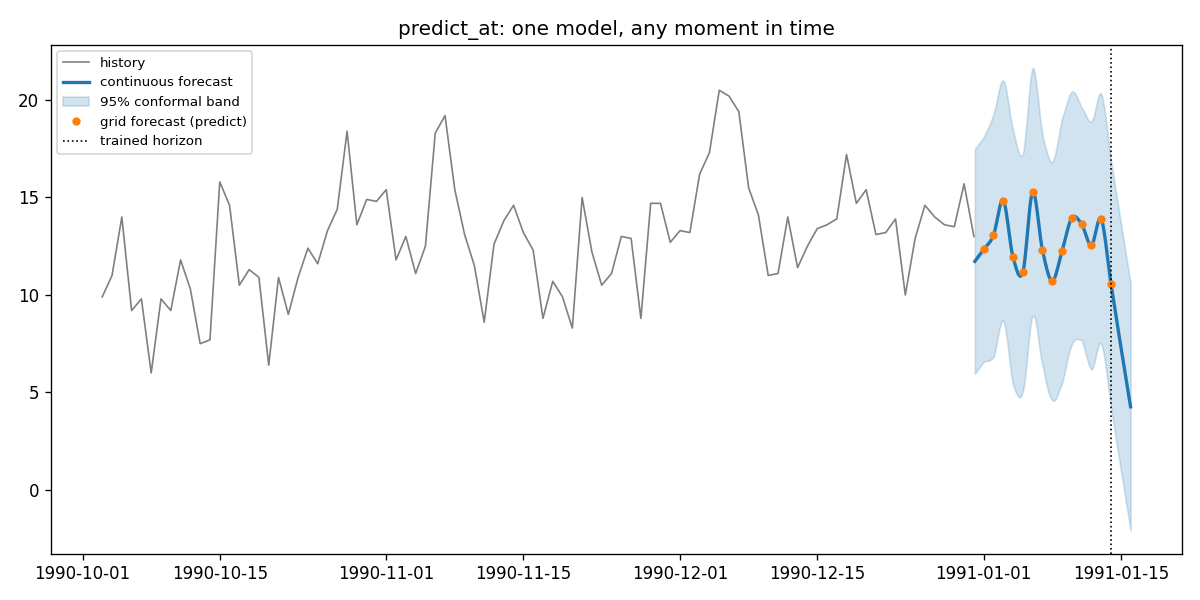
predict_when
A calibrated answer to "when?"
Windows are calibrated on crossing-time errors (time space), not value bands — the distinction that makes the coverage hold. The returned act_by edge is the window’s earliest plausible crossing, which is what you schedule against.
model = APDTFlowForecaster(
    forecast_horizon=24, history_length=48, num_epochs=8,
    decoder_type='continuous', use_conformal=True,
)
model.fit(train, target_col='sunspots')

# "When will solar activity rise above 80?"
result = model.predict_when(80, direction='above', alpha=0.1)
result.eta        # point estimate, e.g. t+9.0 months
result.earliest   # 90% window lower edge
result.latest     # 90% window upper edge
result.act_by     # schedule by THIS, not eta
result.censored   # True if no crossing within the horizon

# risk mode: earliest plausible crossing for safety-critical scheduling
risk = model.predict_when(80, direction='above', mode='risk', alpha=0.1)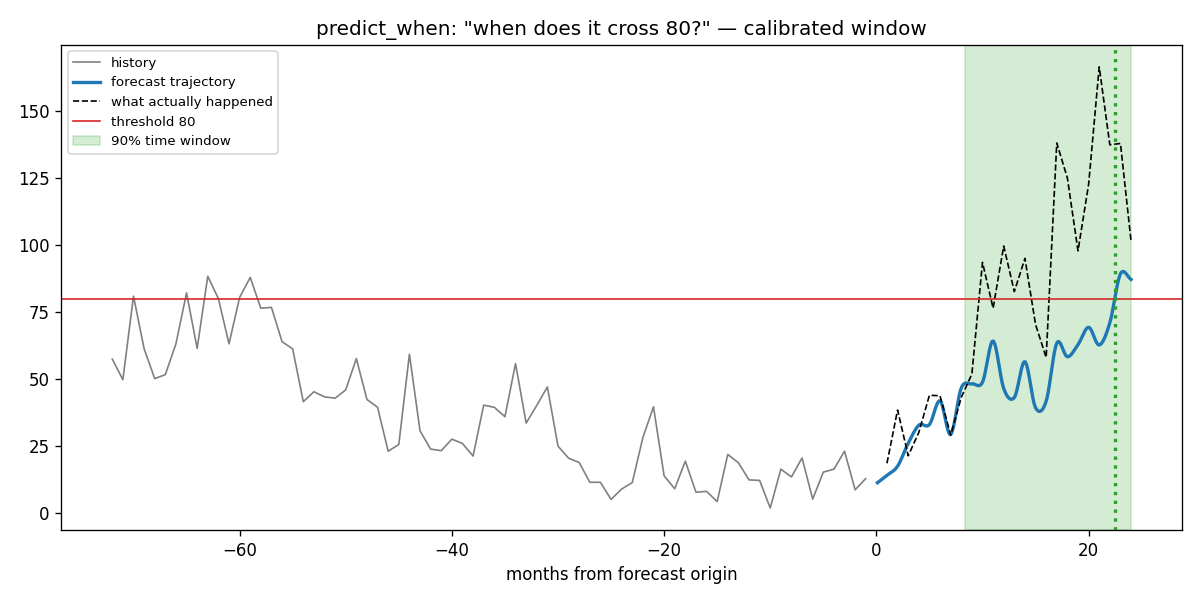
predict_when_fleet
A whole fleet, ranked by act-by date
One call turns real NASA jet engines (never seen in training) into a maintenance schedule sorted by act-by date, with what actually happened marked. In this measured snapshot the calibrated windows covered 81% of the actual crossings.
# a dict of {asset_id: recent_series} for the whole fleet
schedule = model.predict_when_fleet(
    assets, threshold=1.4, direction='below', alpha=0.1,
)

# returns a DataFrame sorted by act_by, ready for a CMMS:
#   asset_id | eta | earliest | latest | act_by | censored | confidence
schedule.to_csv('maintenance_schedule.csv')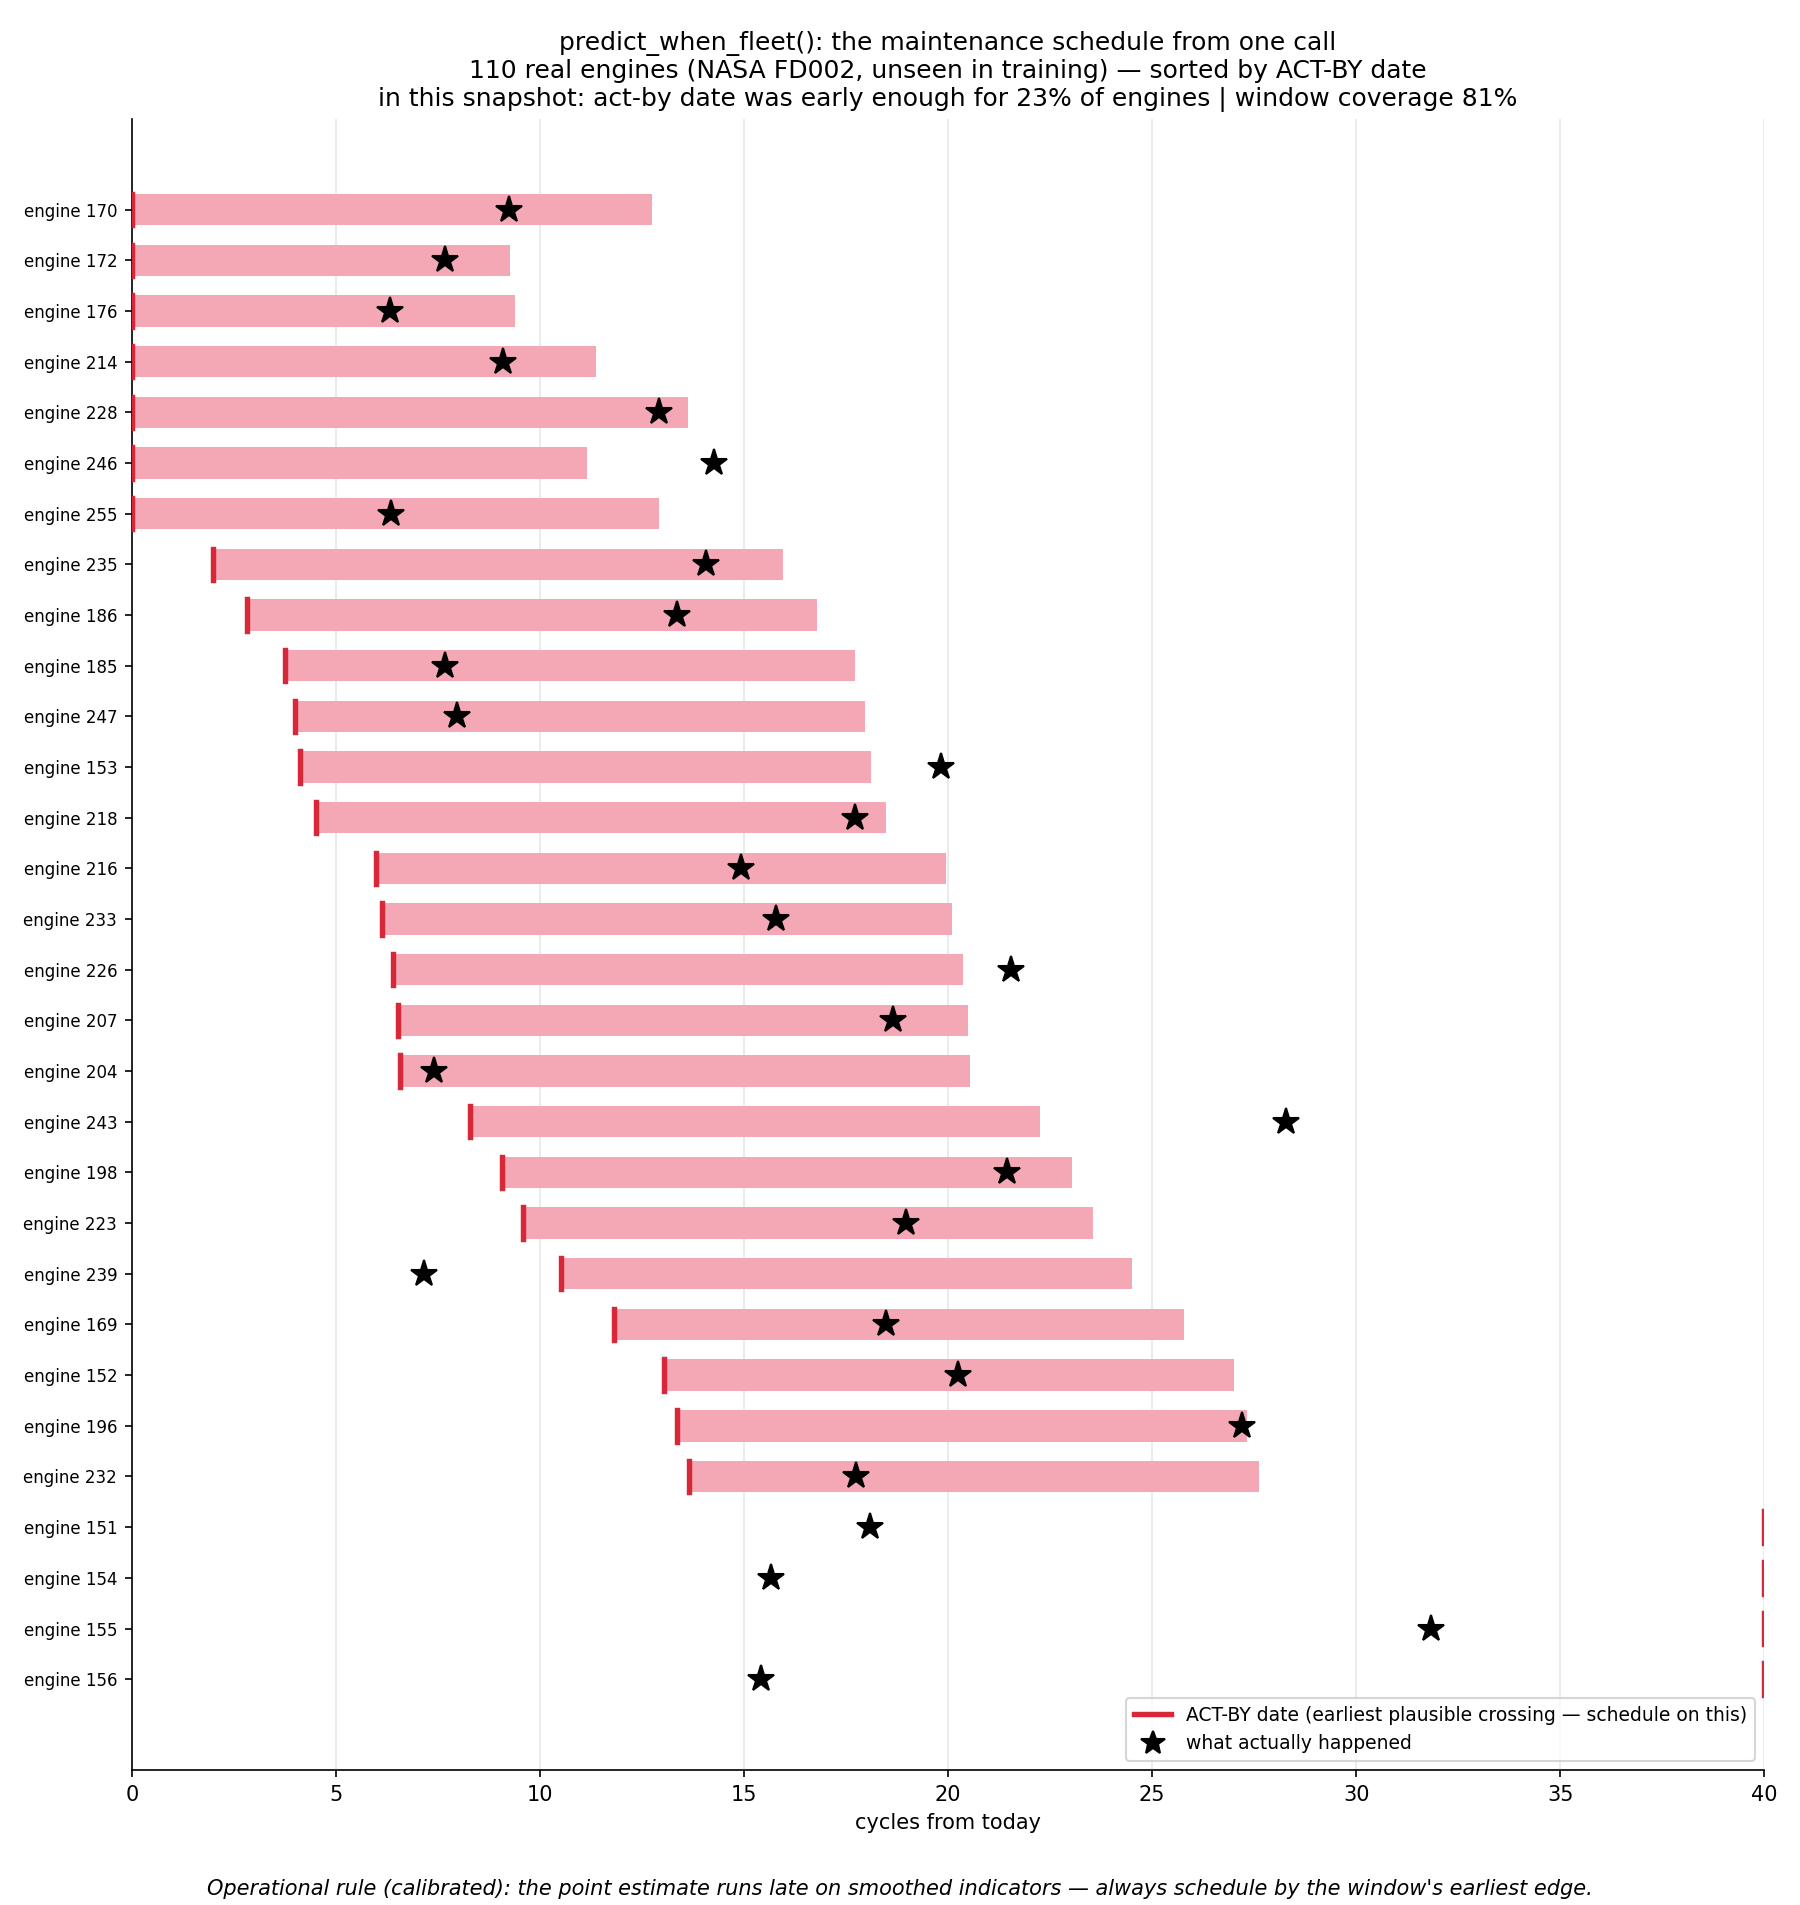
The full demo scripts live in
examples/.
Run them with python examples/predict_when_demo.py,
or jump to the measured benchmarks.