The app, screen by screen
Every screen of the self-hosted app, in the order you meet them - run, read, act, verify, operate - and what the app adds over the CLI.
The command line gives you one audit and one report, on your own disk. The app is the same engine with a memory: your brands, every run you have ever made, a fix tracker that knows what you shipped, scheduled verifies, share links for people with no account, and one place where the keys and the bill belong to somebody. This page is every screen of it, in the order you meet them.
Open the live demo
Every image below is a screenshot of a running deployment, generated by
npm run media and regenerated on every release - never drawn, never
retouched. They come from that same
read-only demo, on the same Kestrel
Uptime sample run the CLI ships with. The operator console has its own page,
The operator console, because the demo refuses
/admin on purpose and those screens come from a local deployment instead.
Run
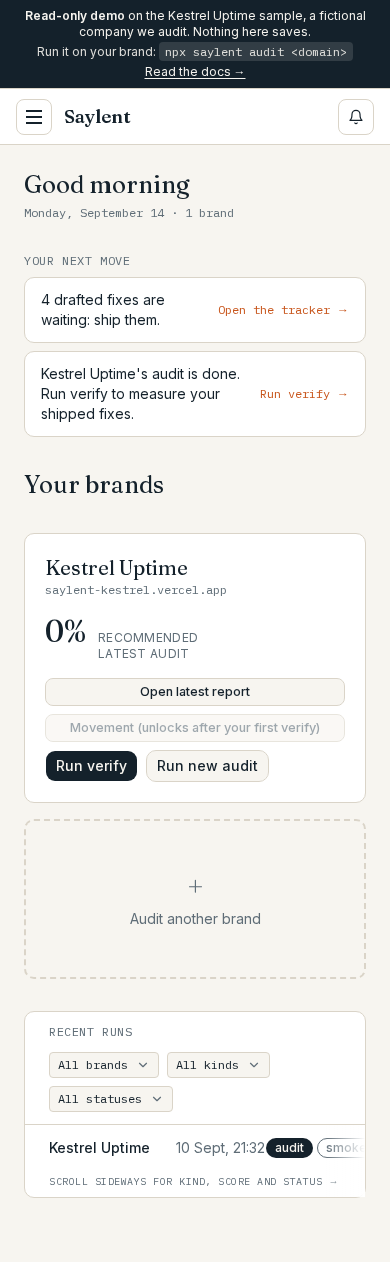
Your brands
You land here: every brand you audit, what its last run said, and the one thing worth doing next.
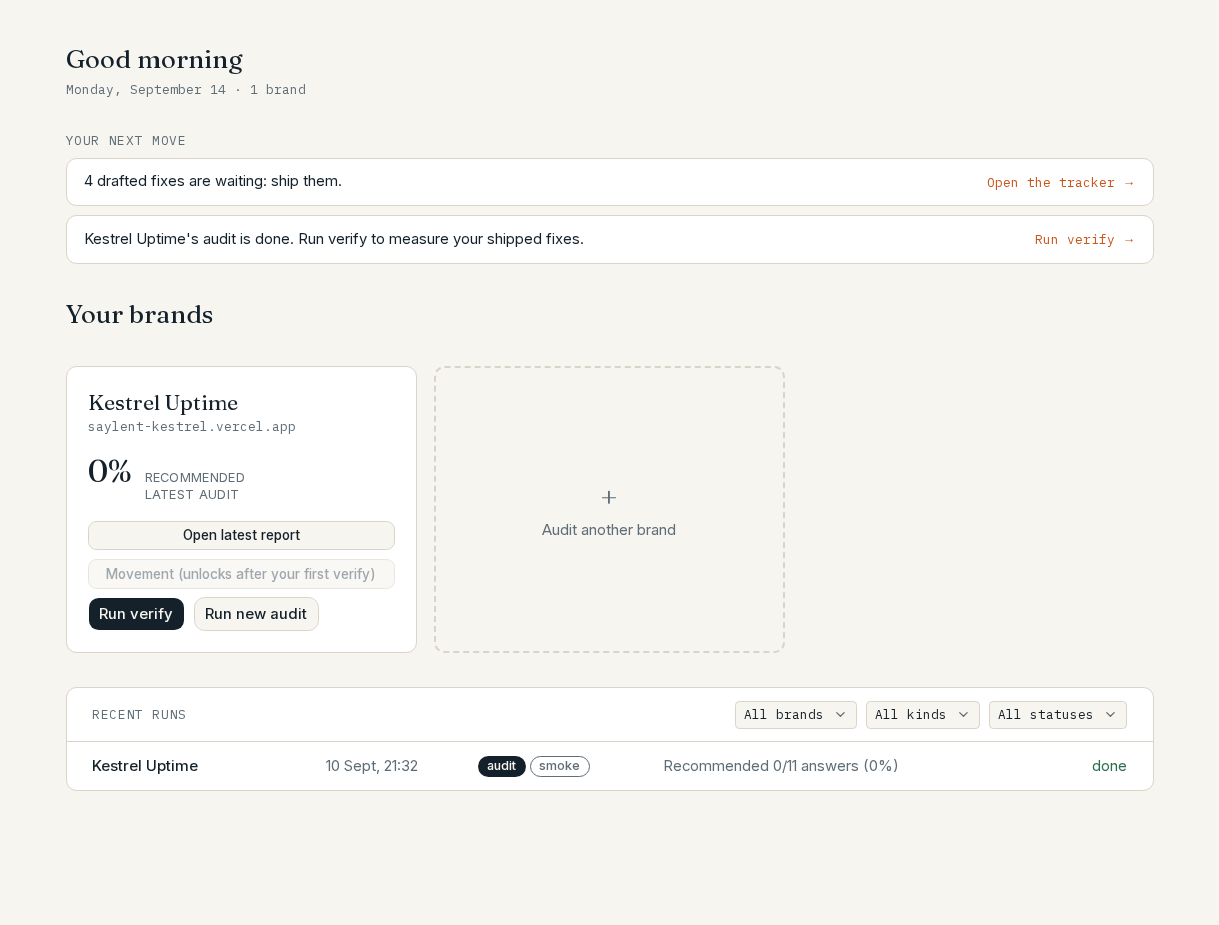
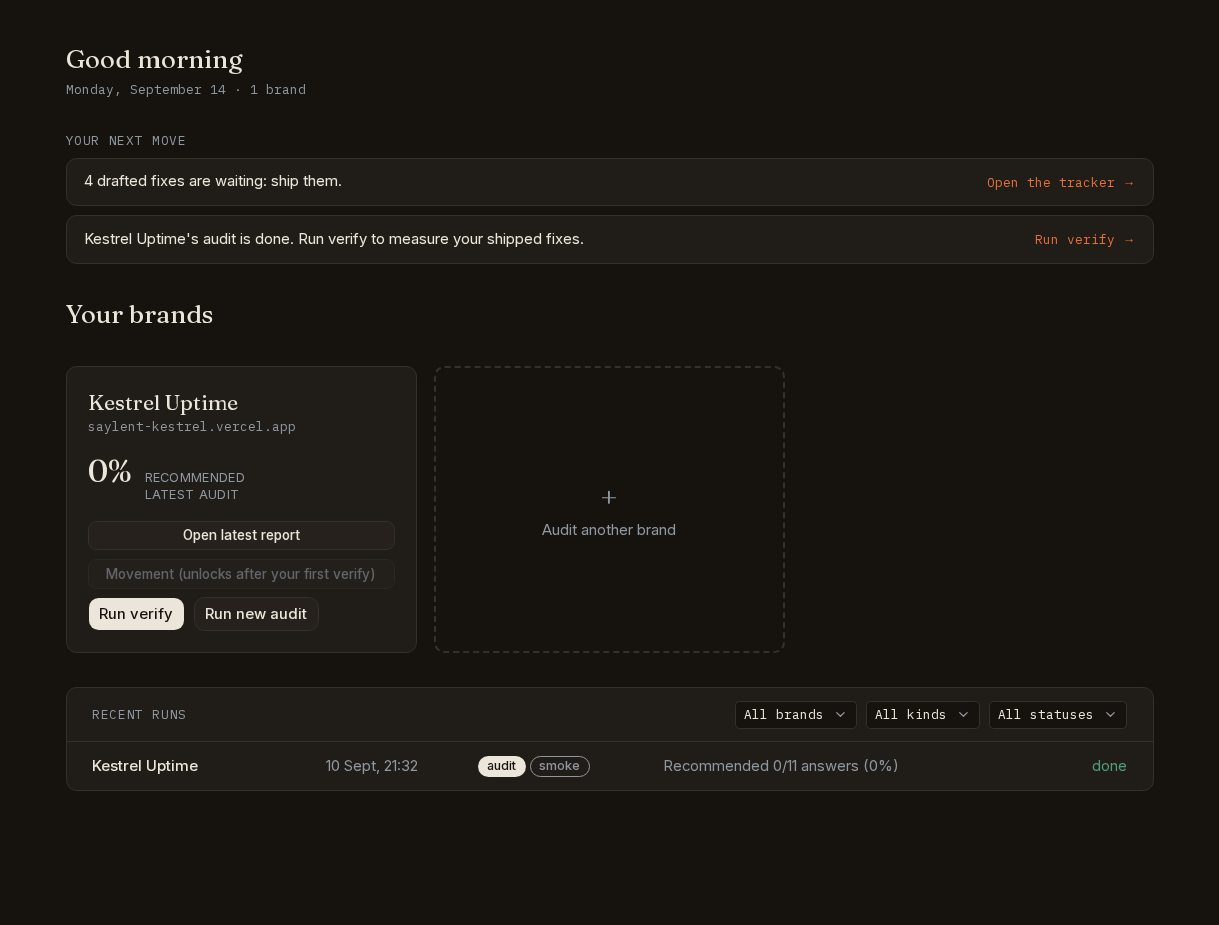
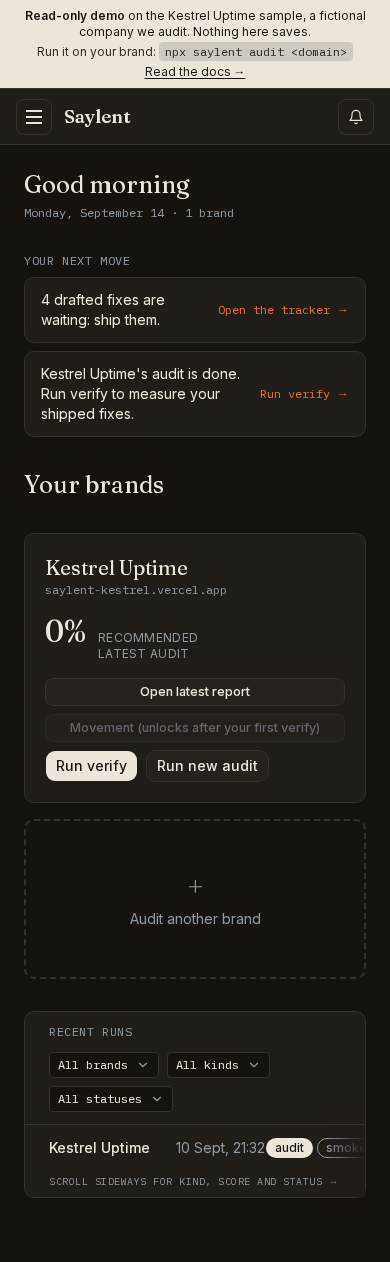
It is the same on a phone - the sidebar folds into a menu and the run table scrolls sideways rather than shrinking its numbers away.
Edit the questions, see the price
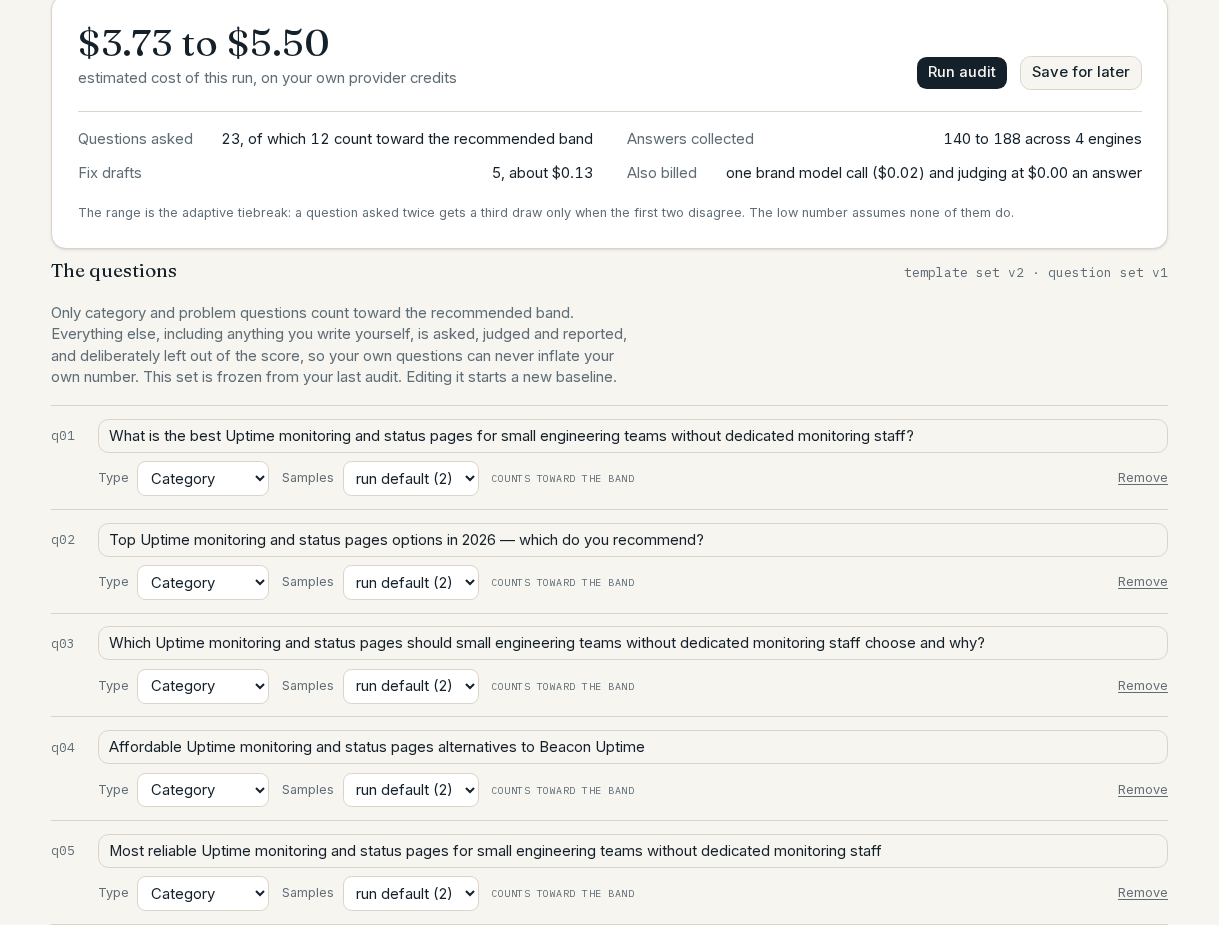
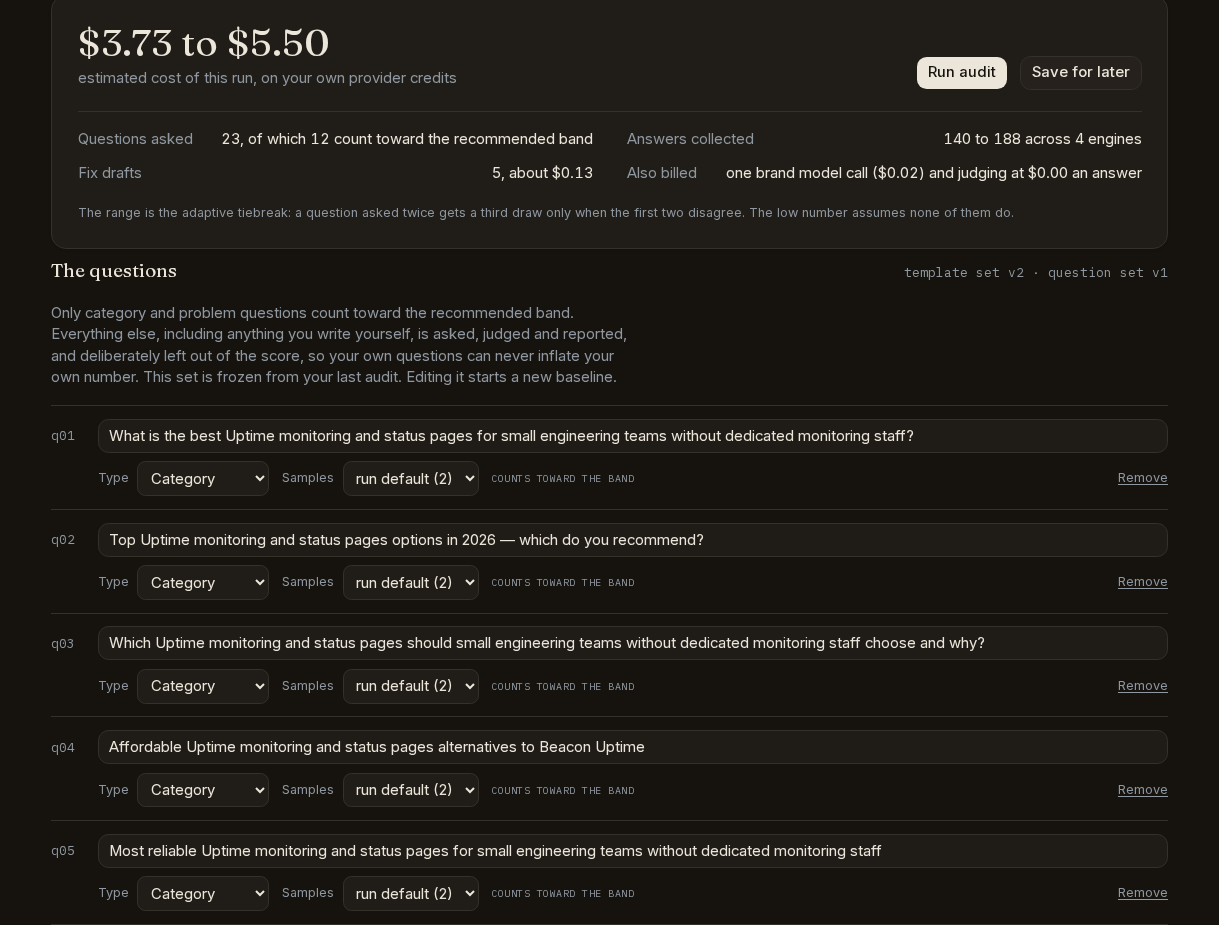
You change any question, its type or its sample count, and the estimate above the editor moves with you before a cent is spent.
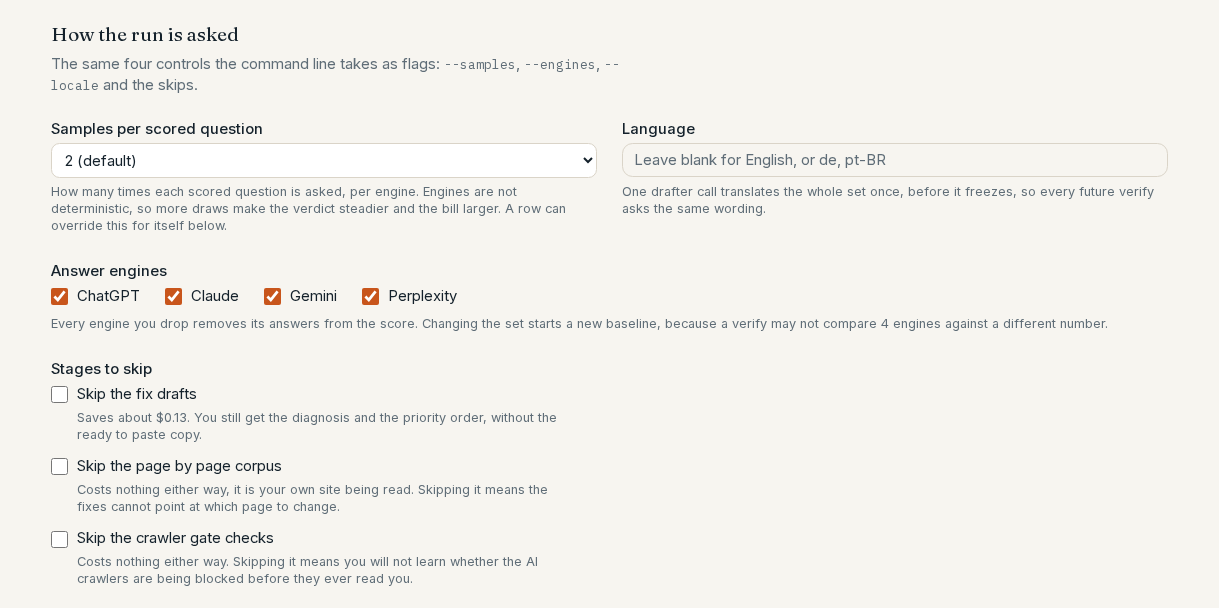
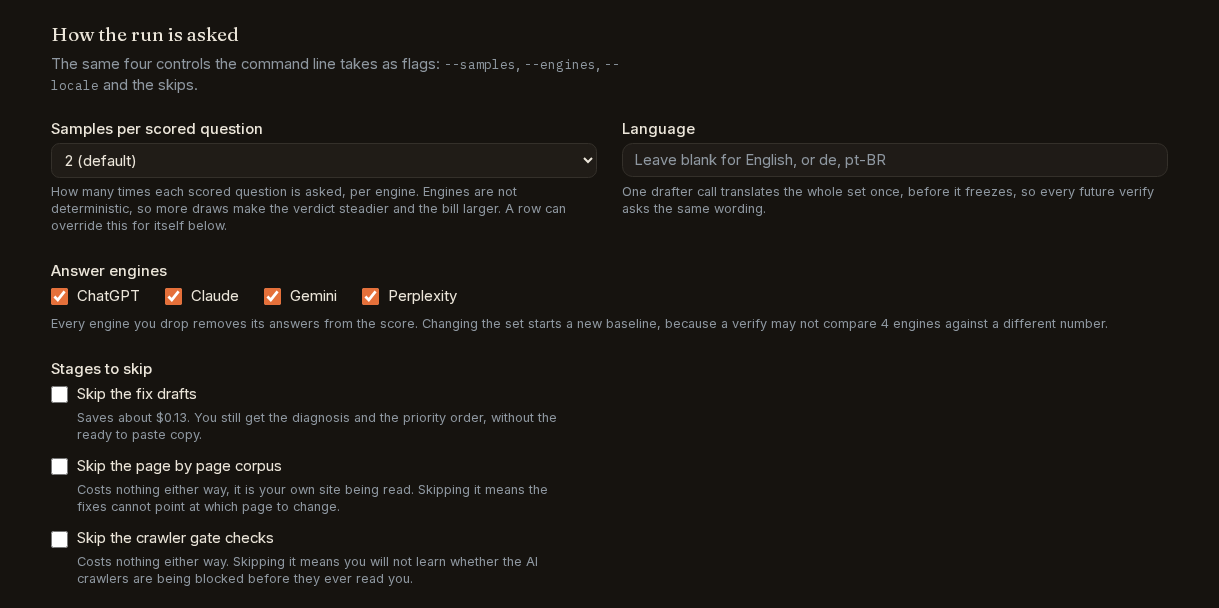
How the run is asked
You set the four controls the command line takes as flags - samples, engines, language, and which stages to skip - on the same page.
Confirm
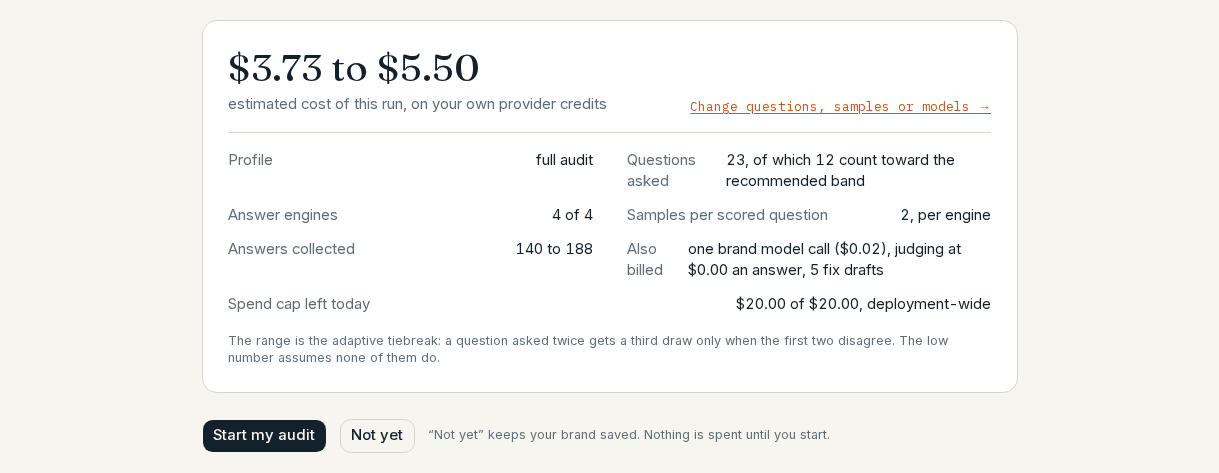
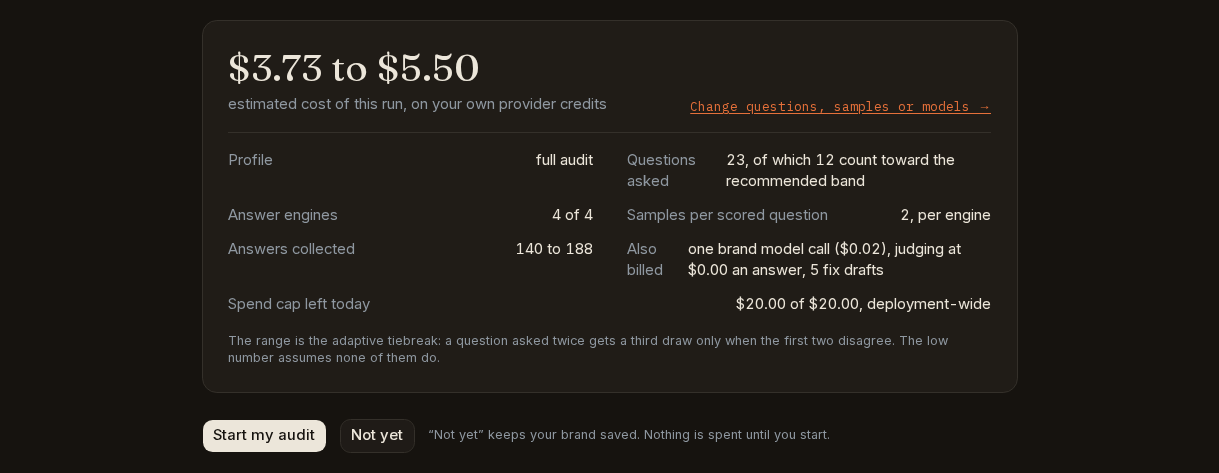
You see the frozen question set and the estimate one more time, directly above the button that spends the money.
Read
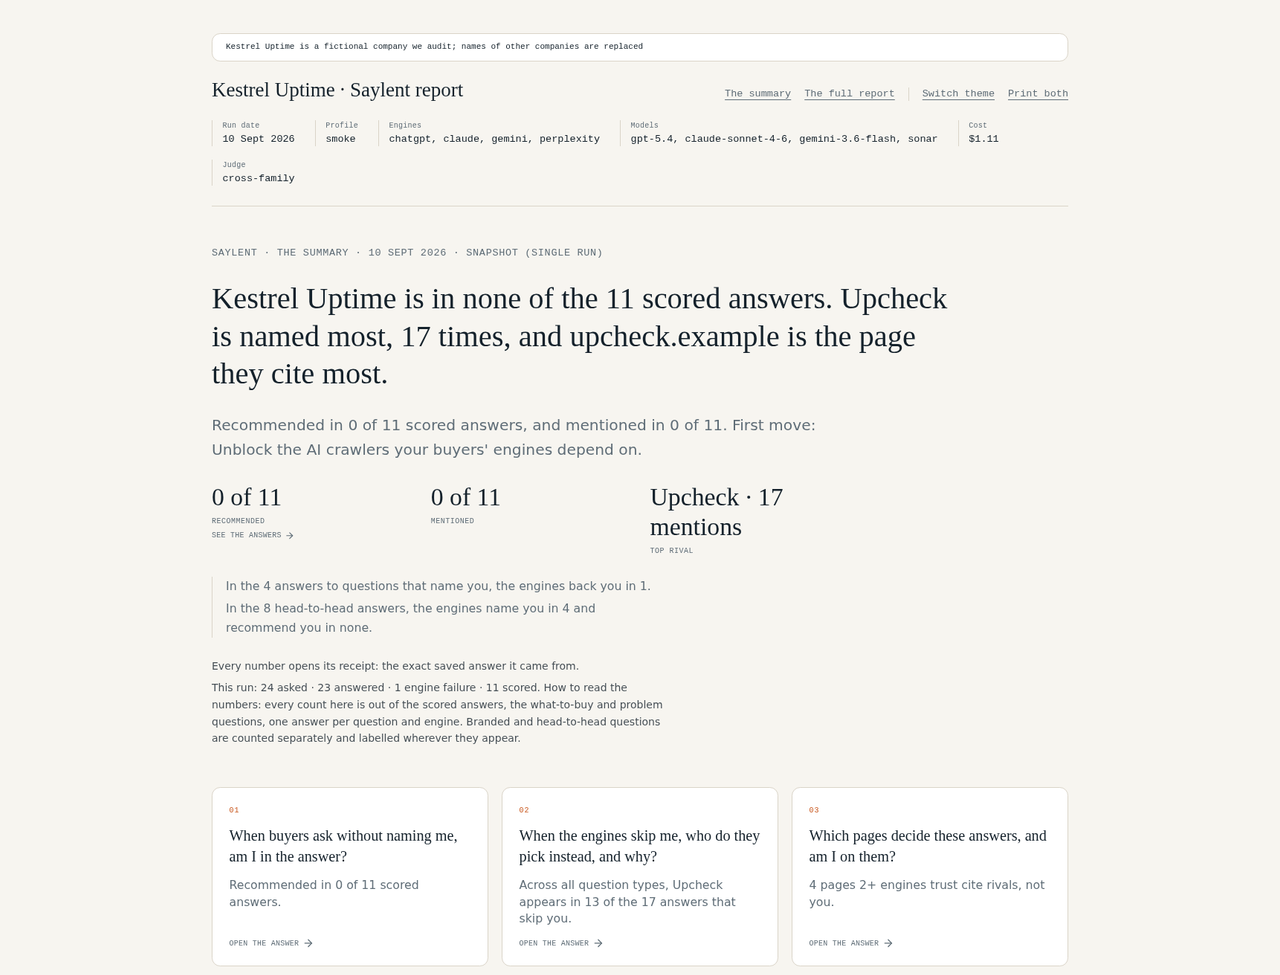
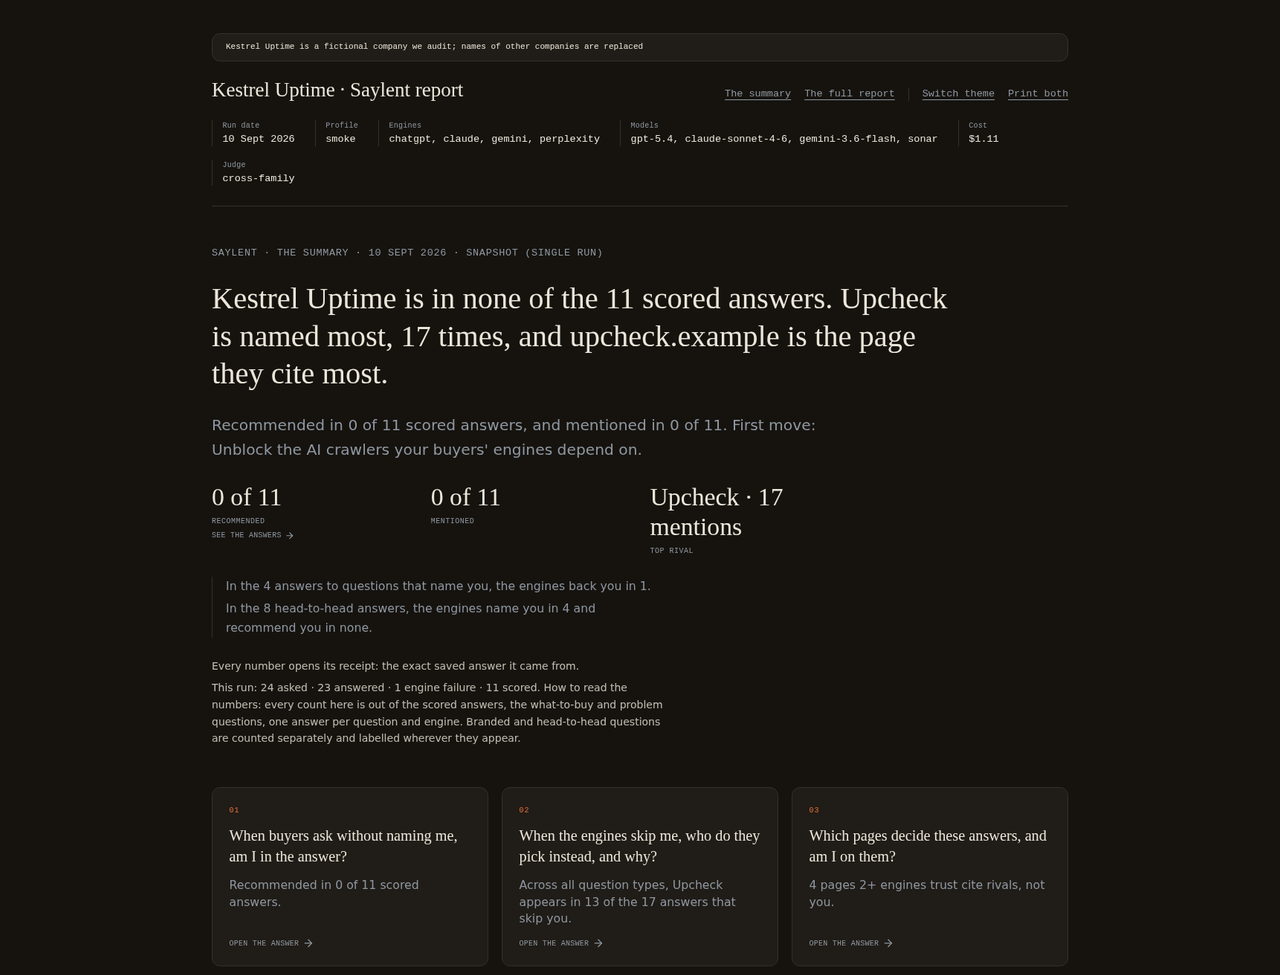
The summary
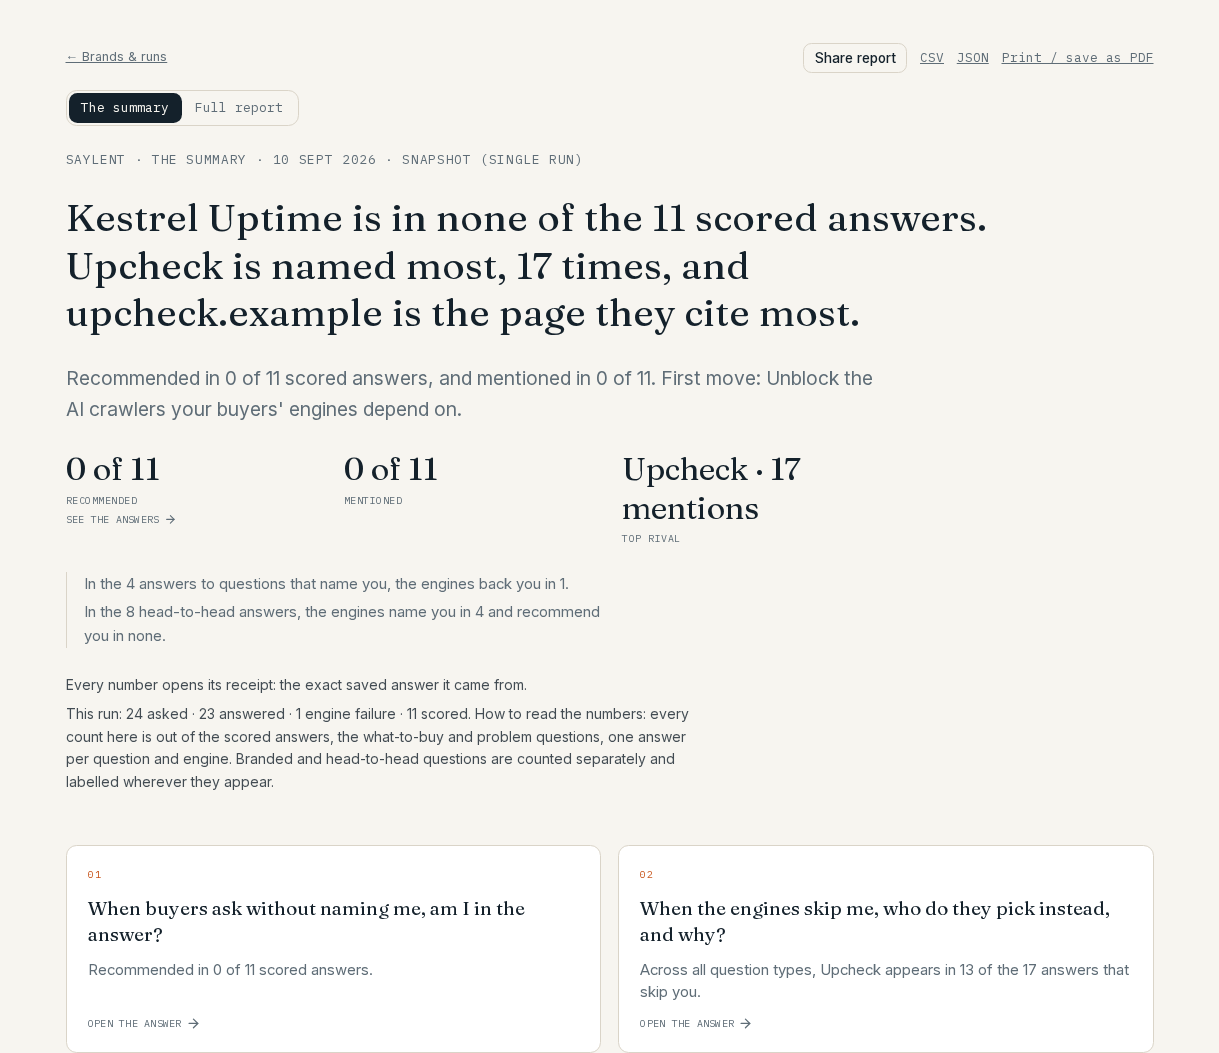
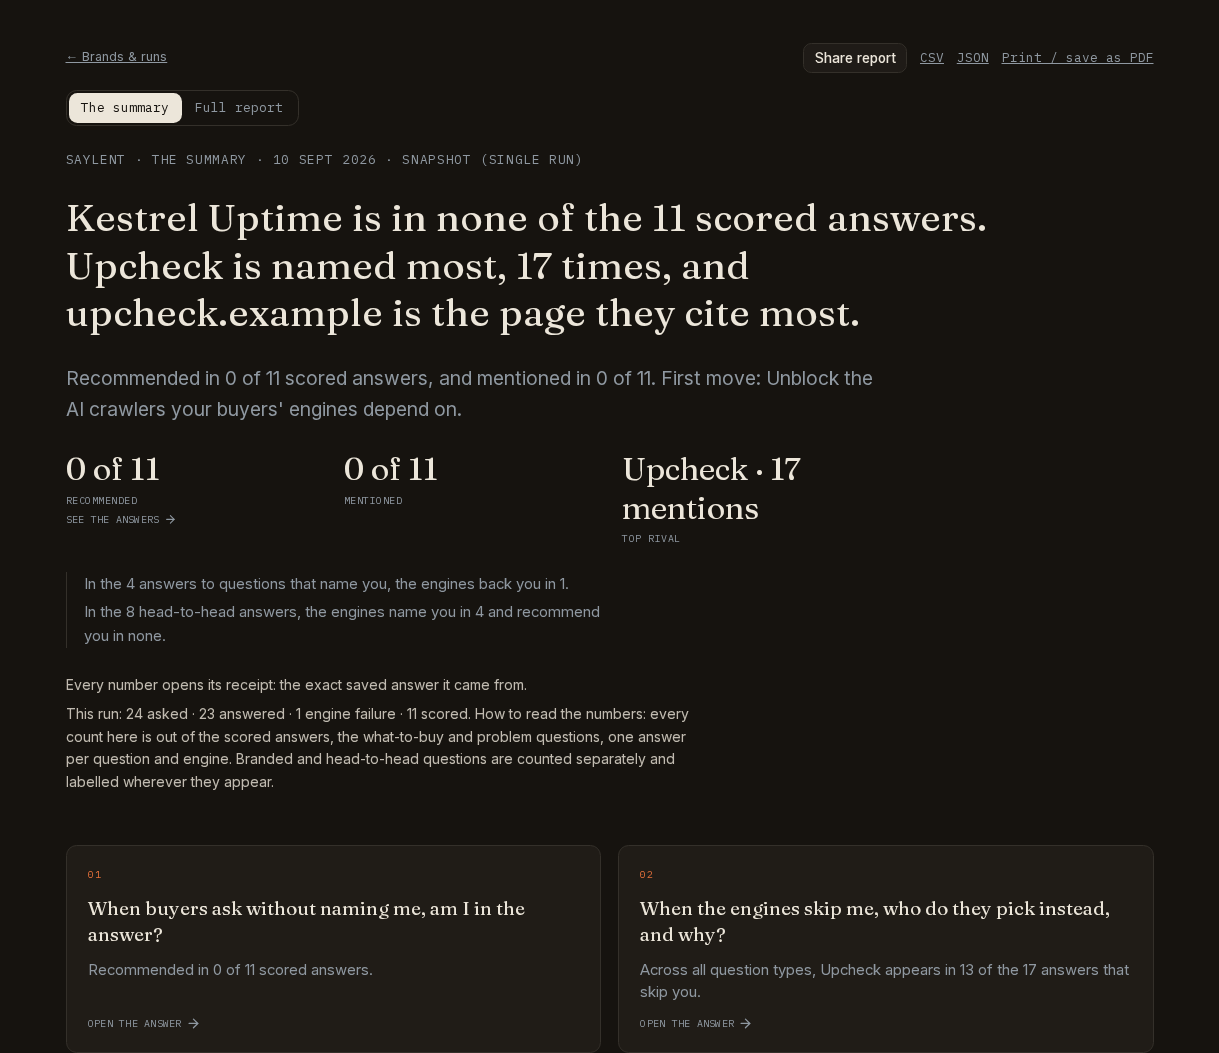
You get the verdict in one sentence, the counts behind it, and the rival named in your place - each one opening the answer it came from.
The full report
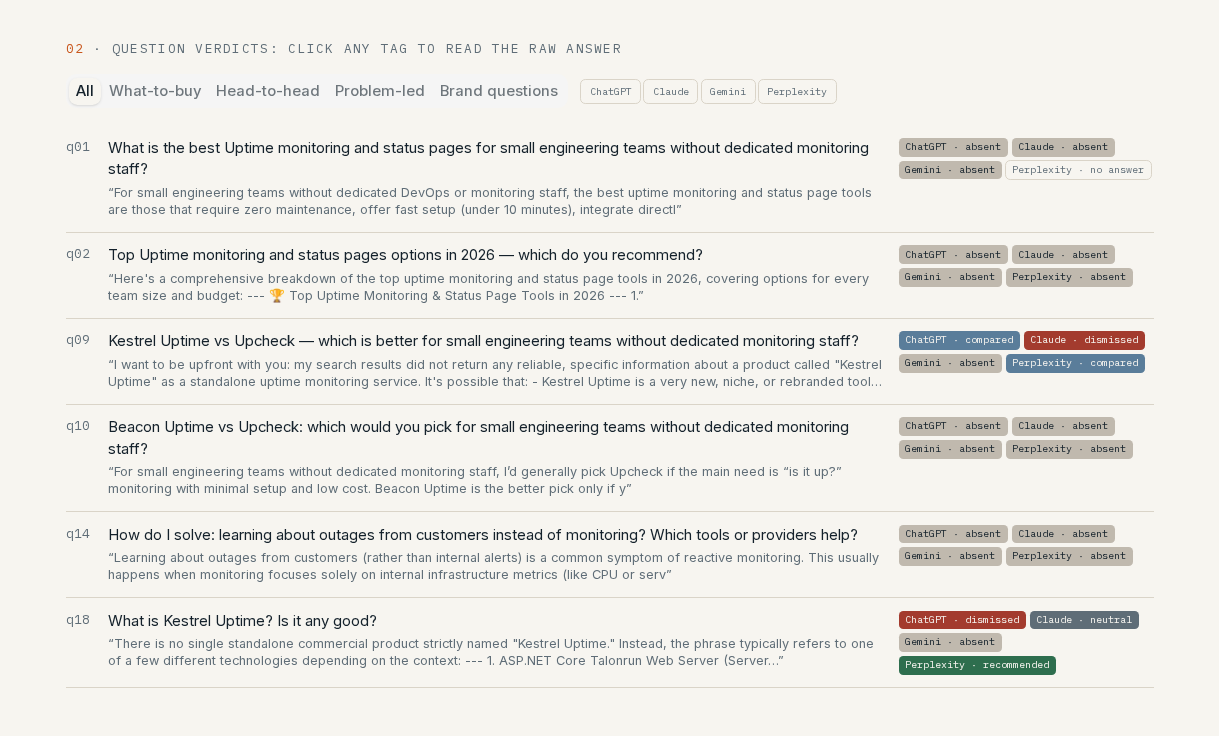
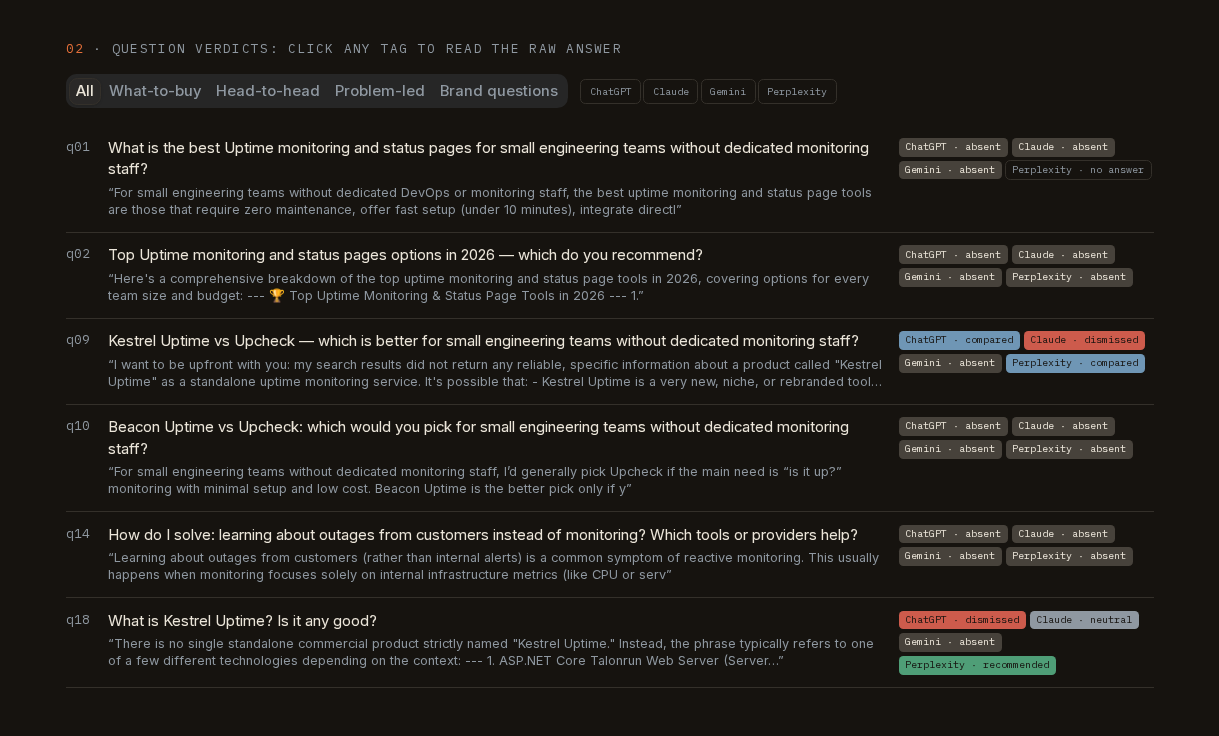
You open the receipts: every question, every engine's verdict, and the raw answer behind any tag you click.
Search
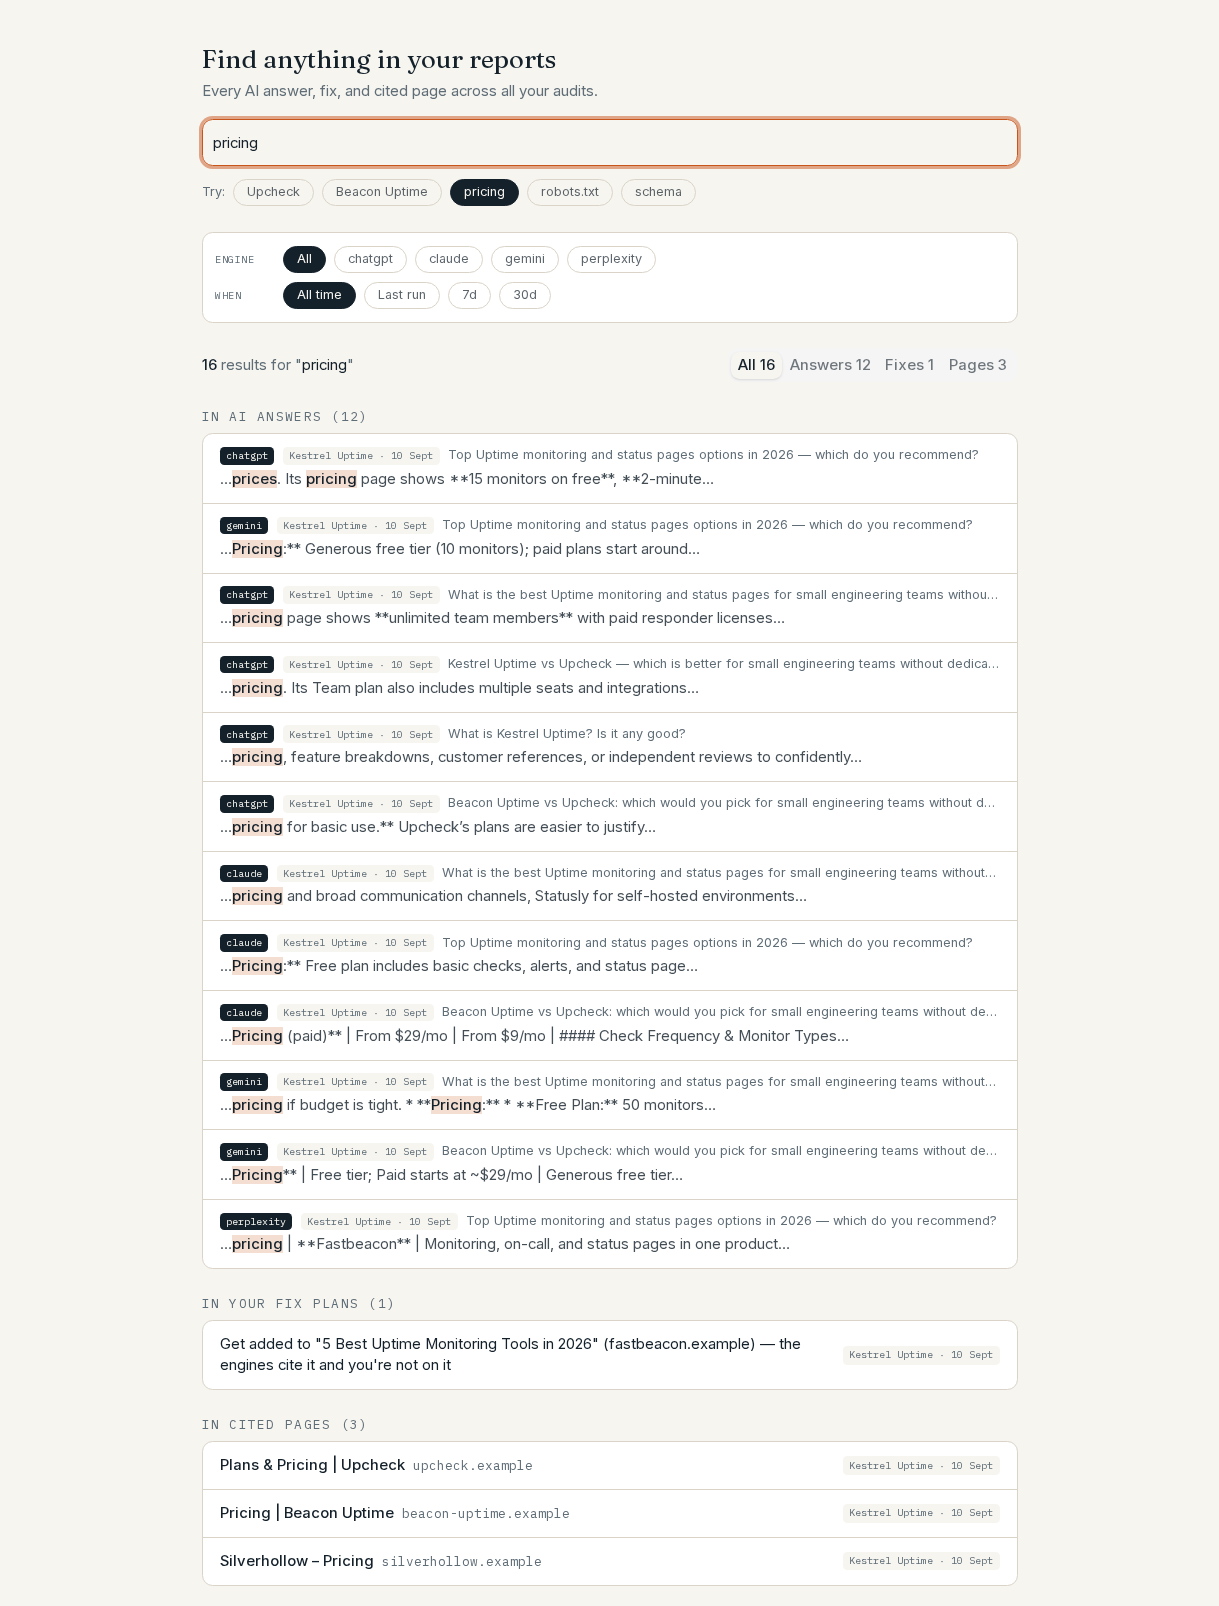
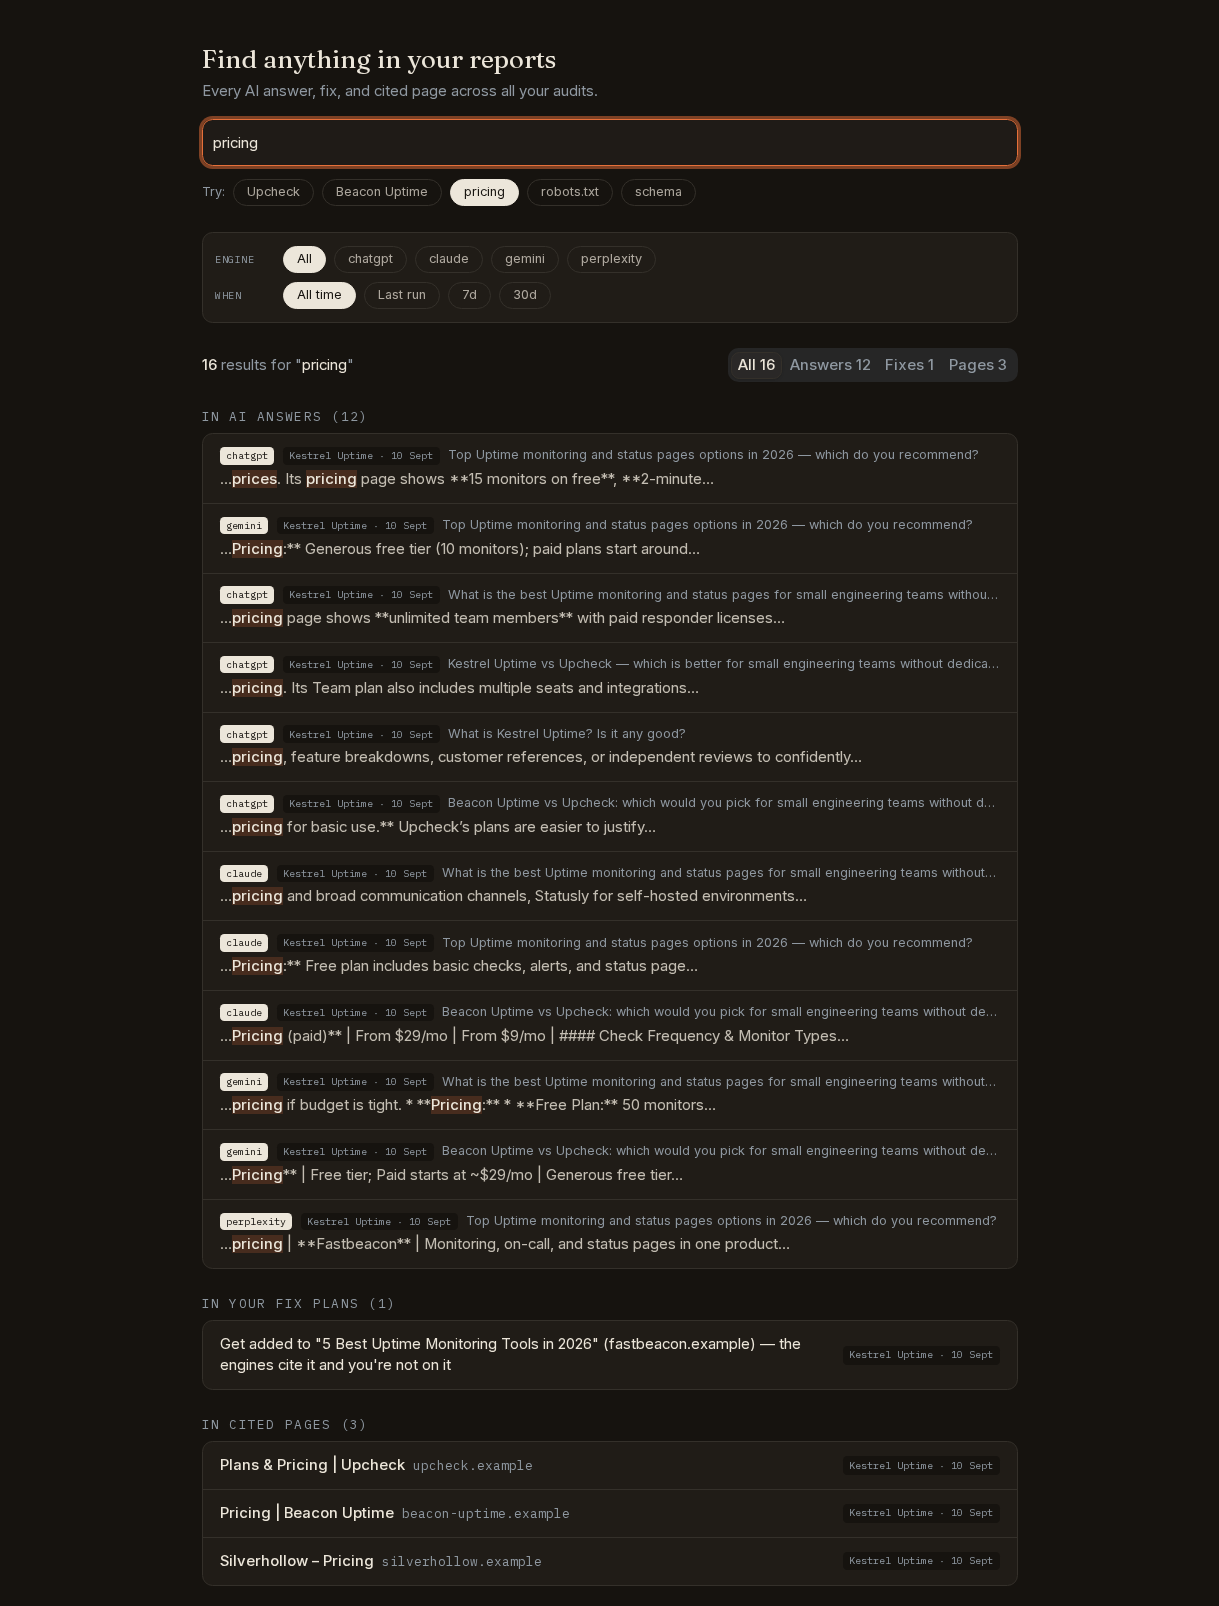
You search one phrase across every answer, fix and cited page you have ever collected, and jump straight to the row it came from.
Act
Fix tracker
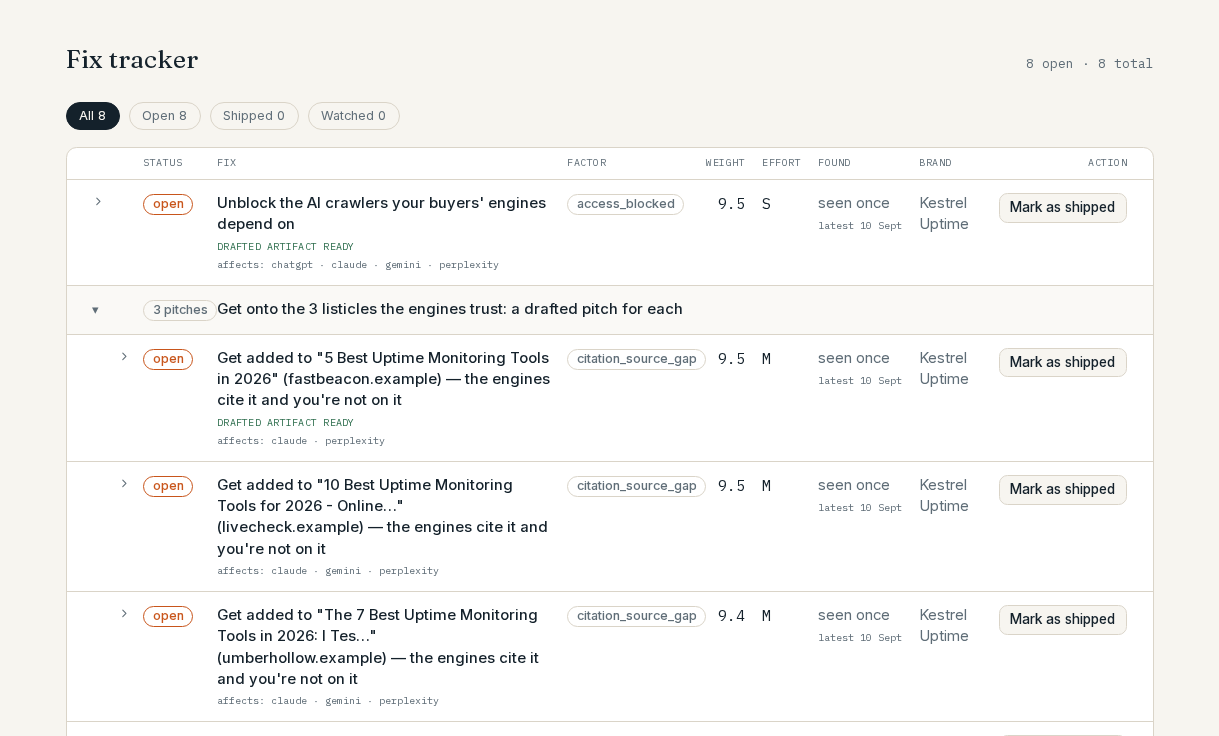
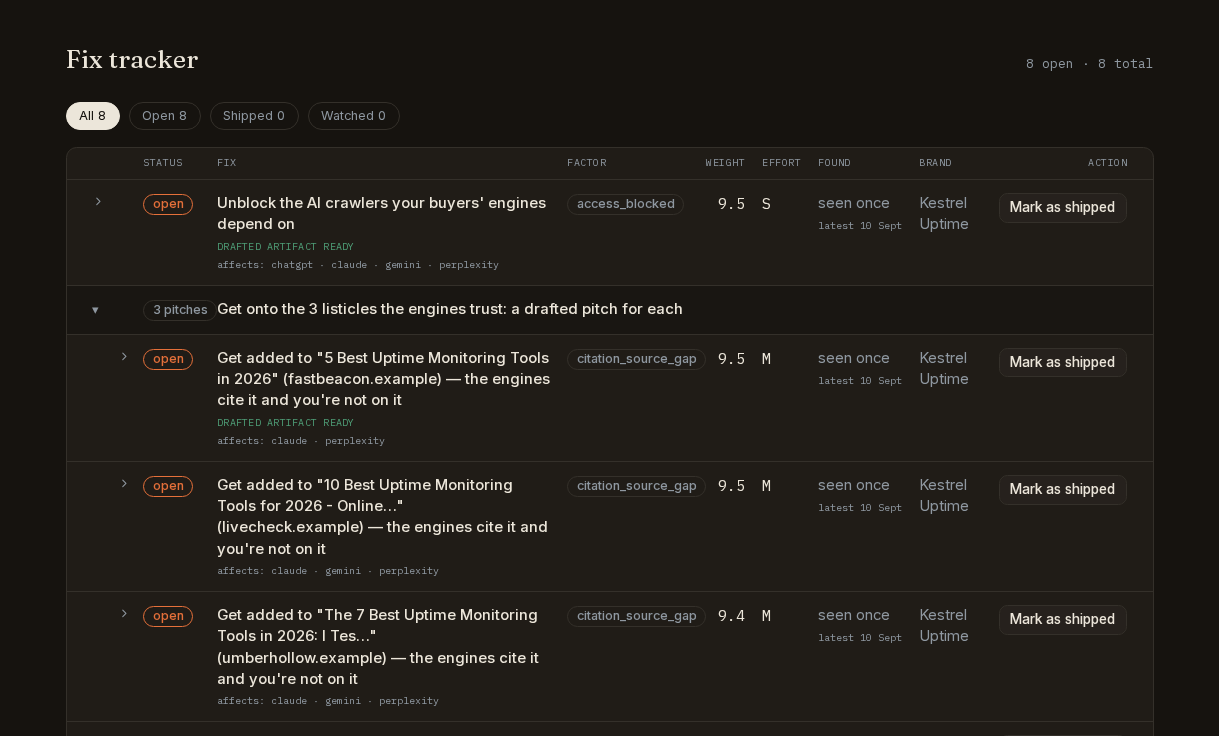
You work the ranked fixes, mark one shipped, and the app remembers which brand now owes a verify.
Compare rivals
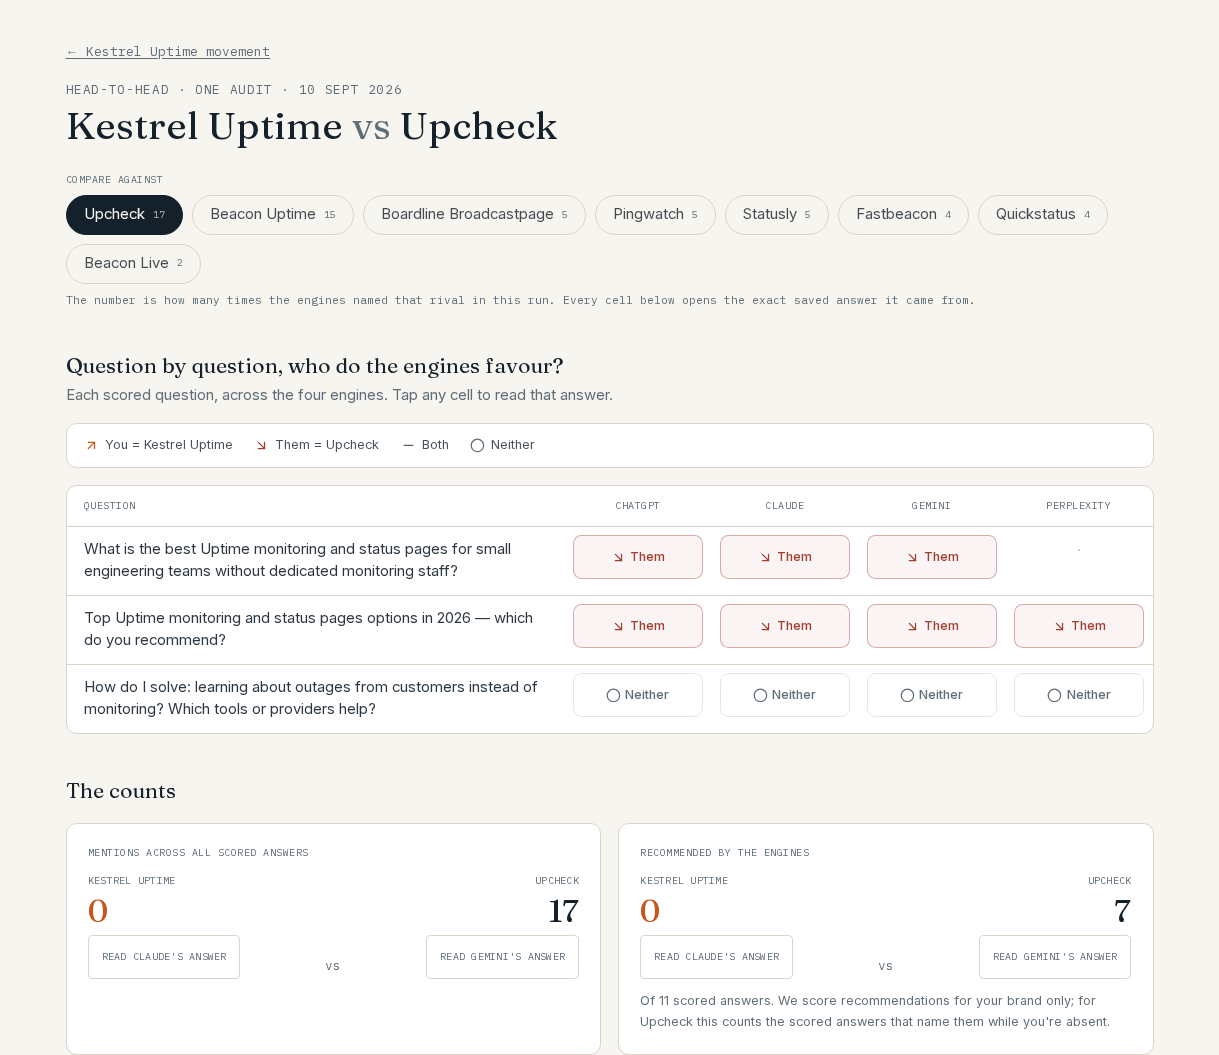
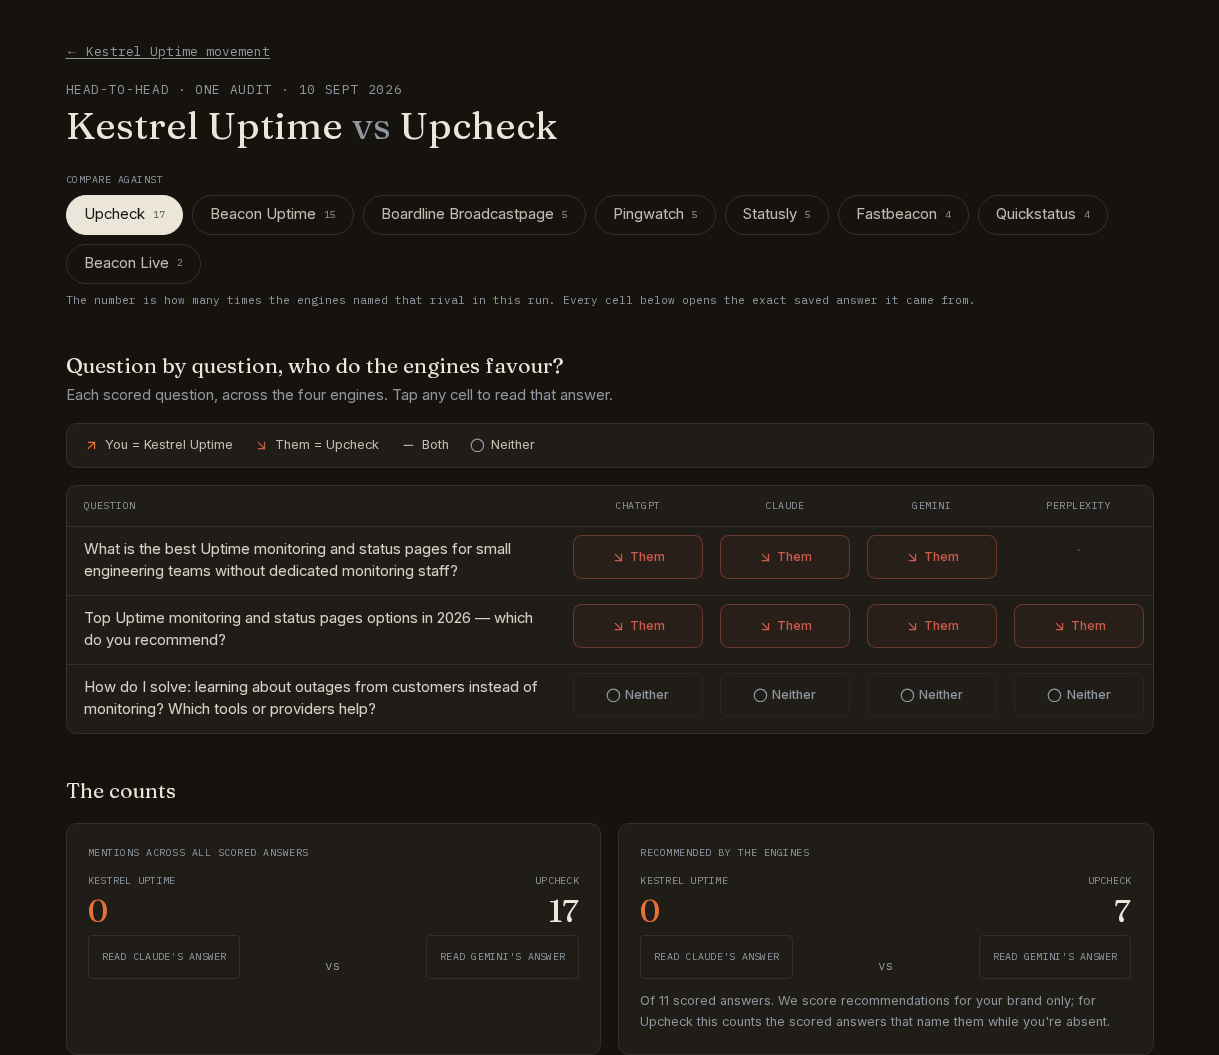
You put your brand next to one rival, question by question, and read where the engines send buyers instead of you.
Verify
The brand page
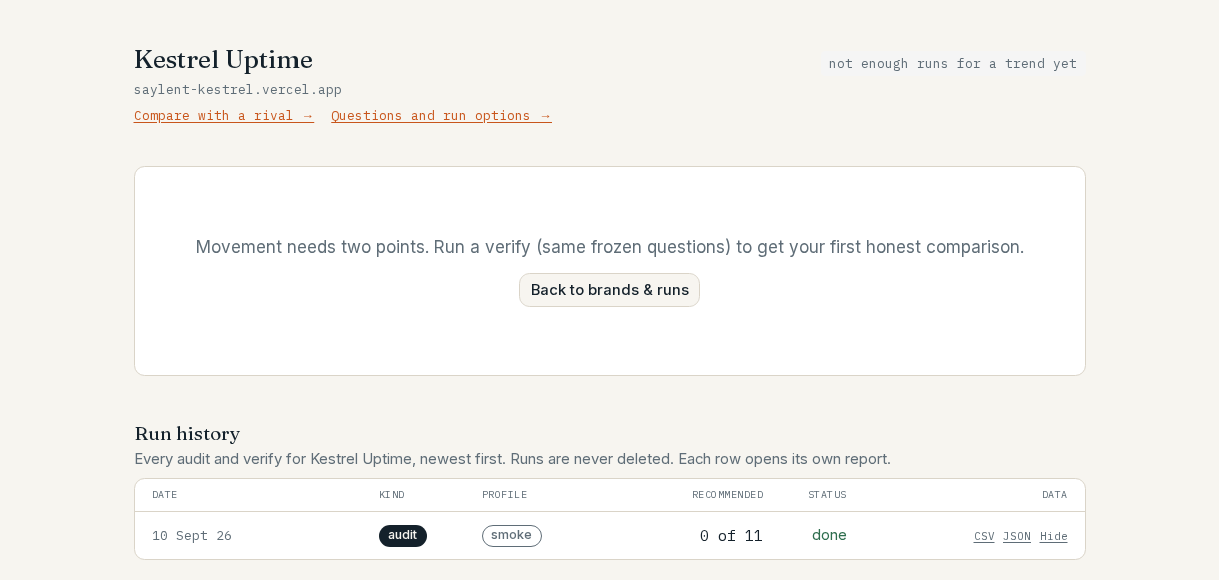
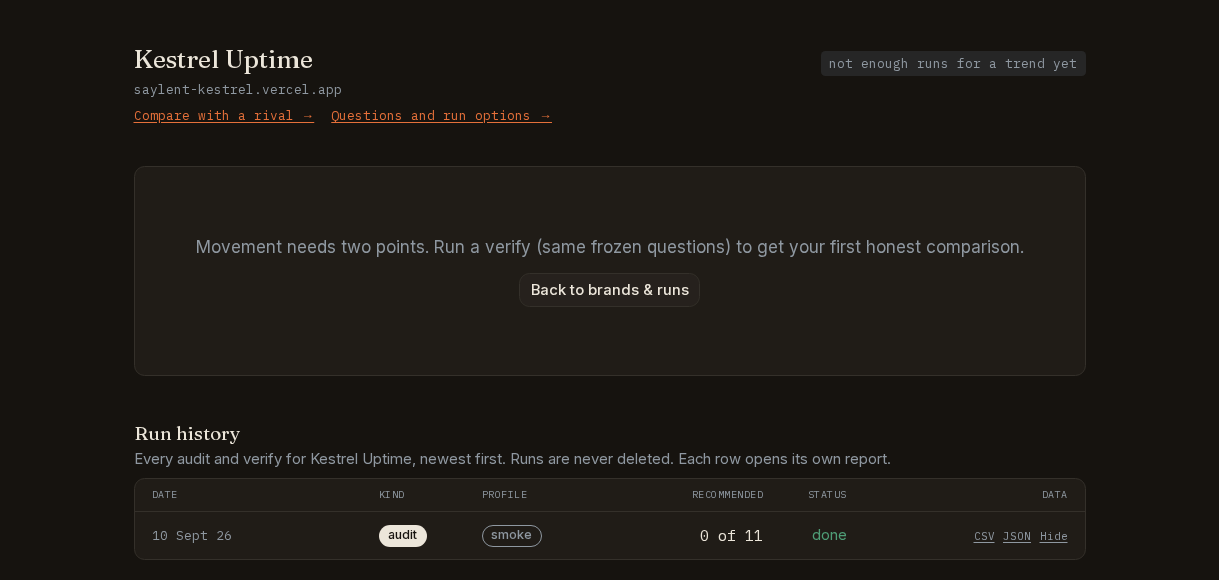
You ship the fixes, run a verify on the same frozen questions, and this page turns into your movement - until then it says so, rather than inventing a trend from one run.
Notifications
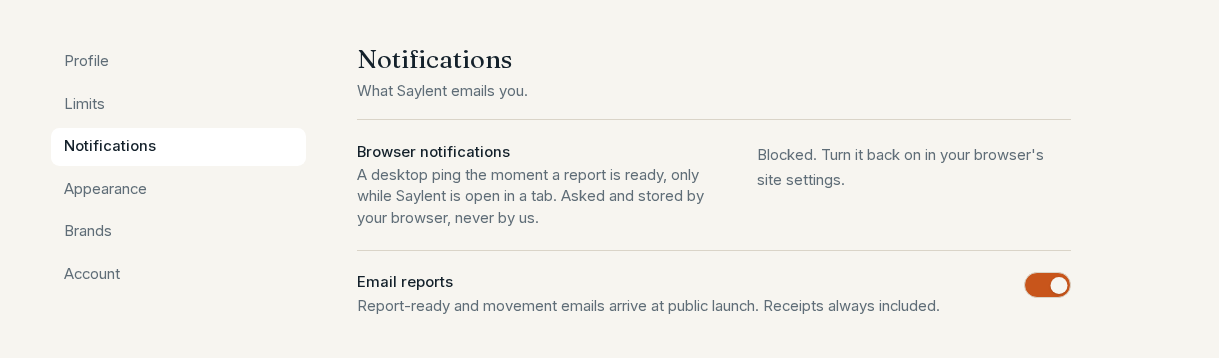
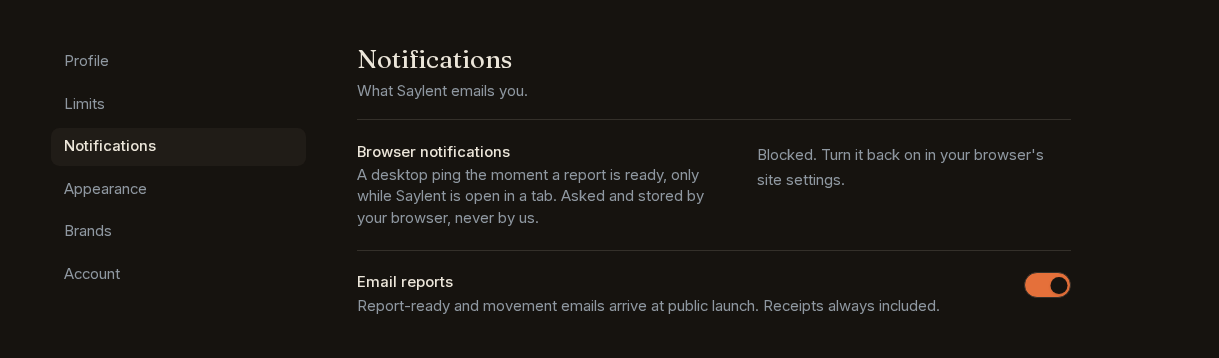
You choose what reaches you: the bell in the top bar, a desktop ping your own browser owns, and email reports once the deployment has a mail key.
Your limits
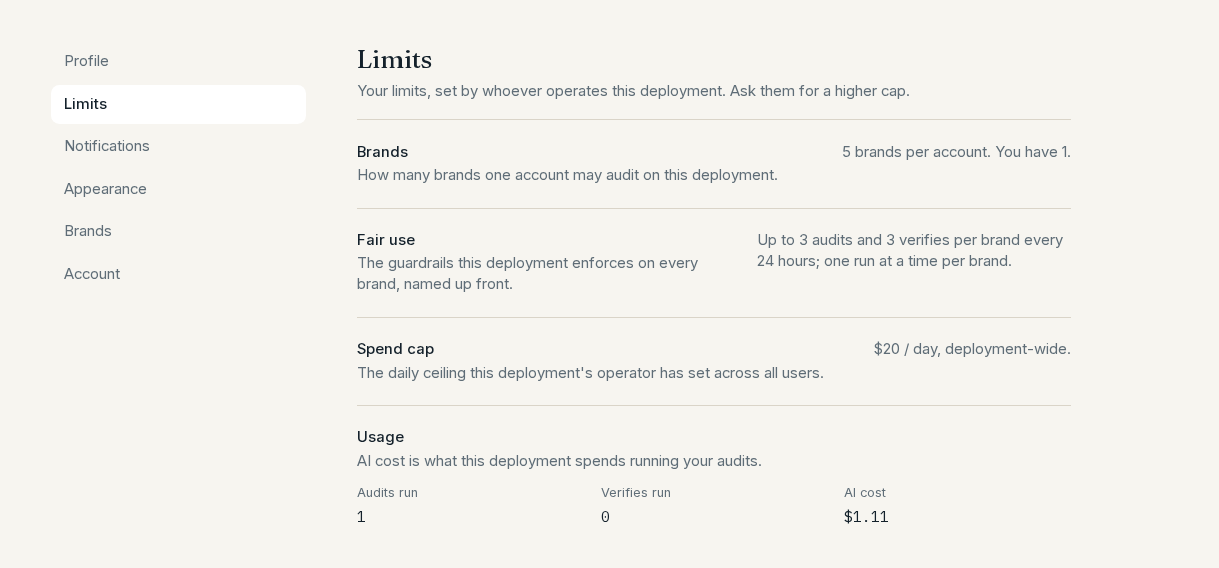
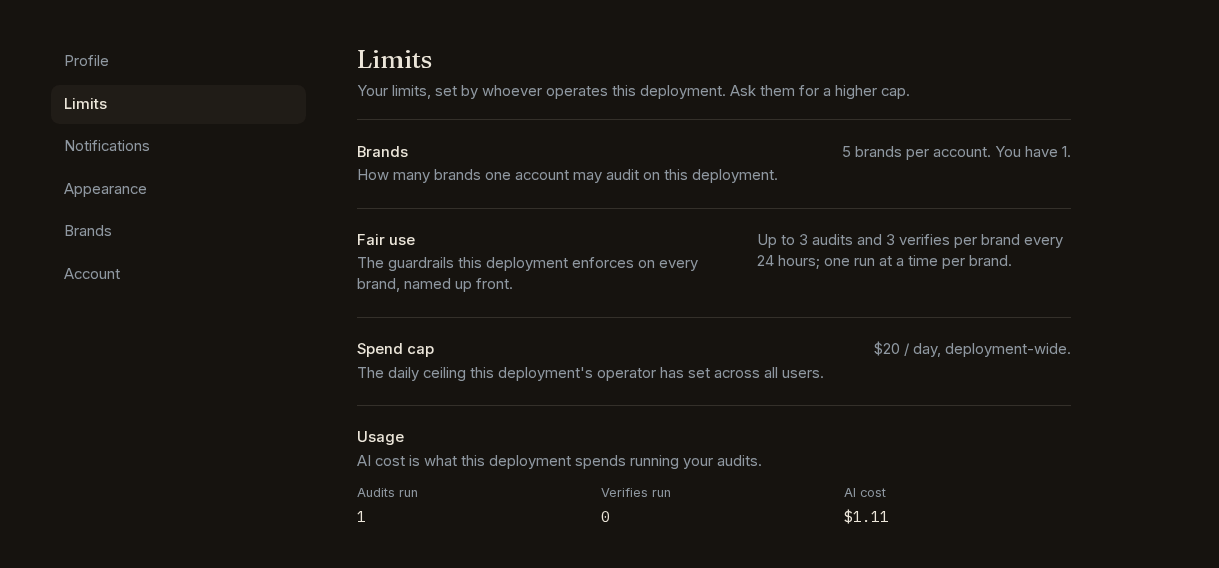
You see the ceilings the operator set for your account - how many brands, how many runs per day, and the deployment's spend cap - before you hit one.
Operate
The rest of the app is the operator console: /setup and /admin/*, visible
only to an account whose role is admin. These screens are the reason the app
exists as well as the command line - somebody owns the keys, the bill and the
blast radius. Every one of them, screen by screen:
The operator console.
What the app adds over the CLI
Same engine, same report, same numbers. What differs is state, other people, and somebody in charge of the bill. "Action" is the GitHub Action, which only ever runs the $0 gate check - it never calls a model, so most rows do not apply to it.
| CLI | App | Action | |
|---|---|---|---|
| Edit, add, remove, tag questions | saylent questions <domain> writes questions.json; edit it, then audit --questions questions.json. An untagged line becomes custom and is never scored. | The questions editor edits the frozen set in place: text, type and Remove, per row. | - |
| Samples per run | --samples 1-5, AUDIT_SAMPLES, or sampling in saylent.config.json. | "Samples per scored question" on the same page. | - |
| Samples per question | a samples field on that row in questions.json. | a per-row Samples select, defaulting to the run's. | - |
| Models per role | --model <role>=<model> (repeatable), --judge, --judge-family, or the MODEL_* environment variables. | Models per role: every role, the model in force, its source, an override, and a reason for the log. | - |
| Skip stages | --skip drafts,corpus,gates. | Three checkboxes, each saying what it saves and what it costs you. | - |
| Spend cap | --max-usd <n> refuses a single run whose high estimate is over it. | a deployment-wide daily cap, plus a per-user brand limit and a run throttle. | $0 - it has no keys. |
| Kill switch | Ctrl-C. | Pause all runs: every new run is refused while it is on. | - |
| Scheduled verifies | your own cron or CI step running saylent verify run.json. | a weekly verify and a monthly audit per brand, at the owner's local 09:00, once the operator turns FLAG_SCHEDULED_RUNS on. | its own schedule: trigger, for the gate check. |
| Share links | the report.html file itself - mail it, drop it in Slack. | Share report mints a read-only /share/<token> page you can revoke. | - |
| Compare rivals | share of voice and the rival tables inside the report. | a page of its own, question by question, per rival. | - |
| Movement | saylent verify re-asks the frozen set and its report shows before and after. | the brand page keeps every run and draws the trend once a verify exists. | - |
| Fix tracker | the report ranks the fixes and carries the paste-ready artifacts; it holds no state. | open / shipped / watched per fix, and it asks for a verify once you ship one. | - |
| Audit log | no operator, so nothing to log. | append-only: actor, action, target, reason. | - |
| Takedowns | - | block a domain deployment-wide, with a reason on the record. | - |
| Multi-user | one machine, one person, one set of keys. | accounts with row-level security per user, plus an operator view of any one of them. | - |
Ready to run it yourself? Deploy the app - local, your own server, or a managed platform. Running it for other people as well? The operator console is the rest of the story. Or start with one command and no deployment at all.